
Insights and analytics
How to read your community's Insights page — stat cards, growth charts, Key Insights, and exporting your data as a CSV.
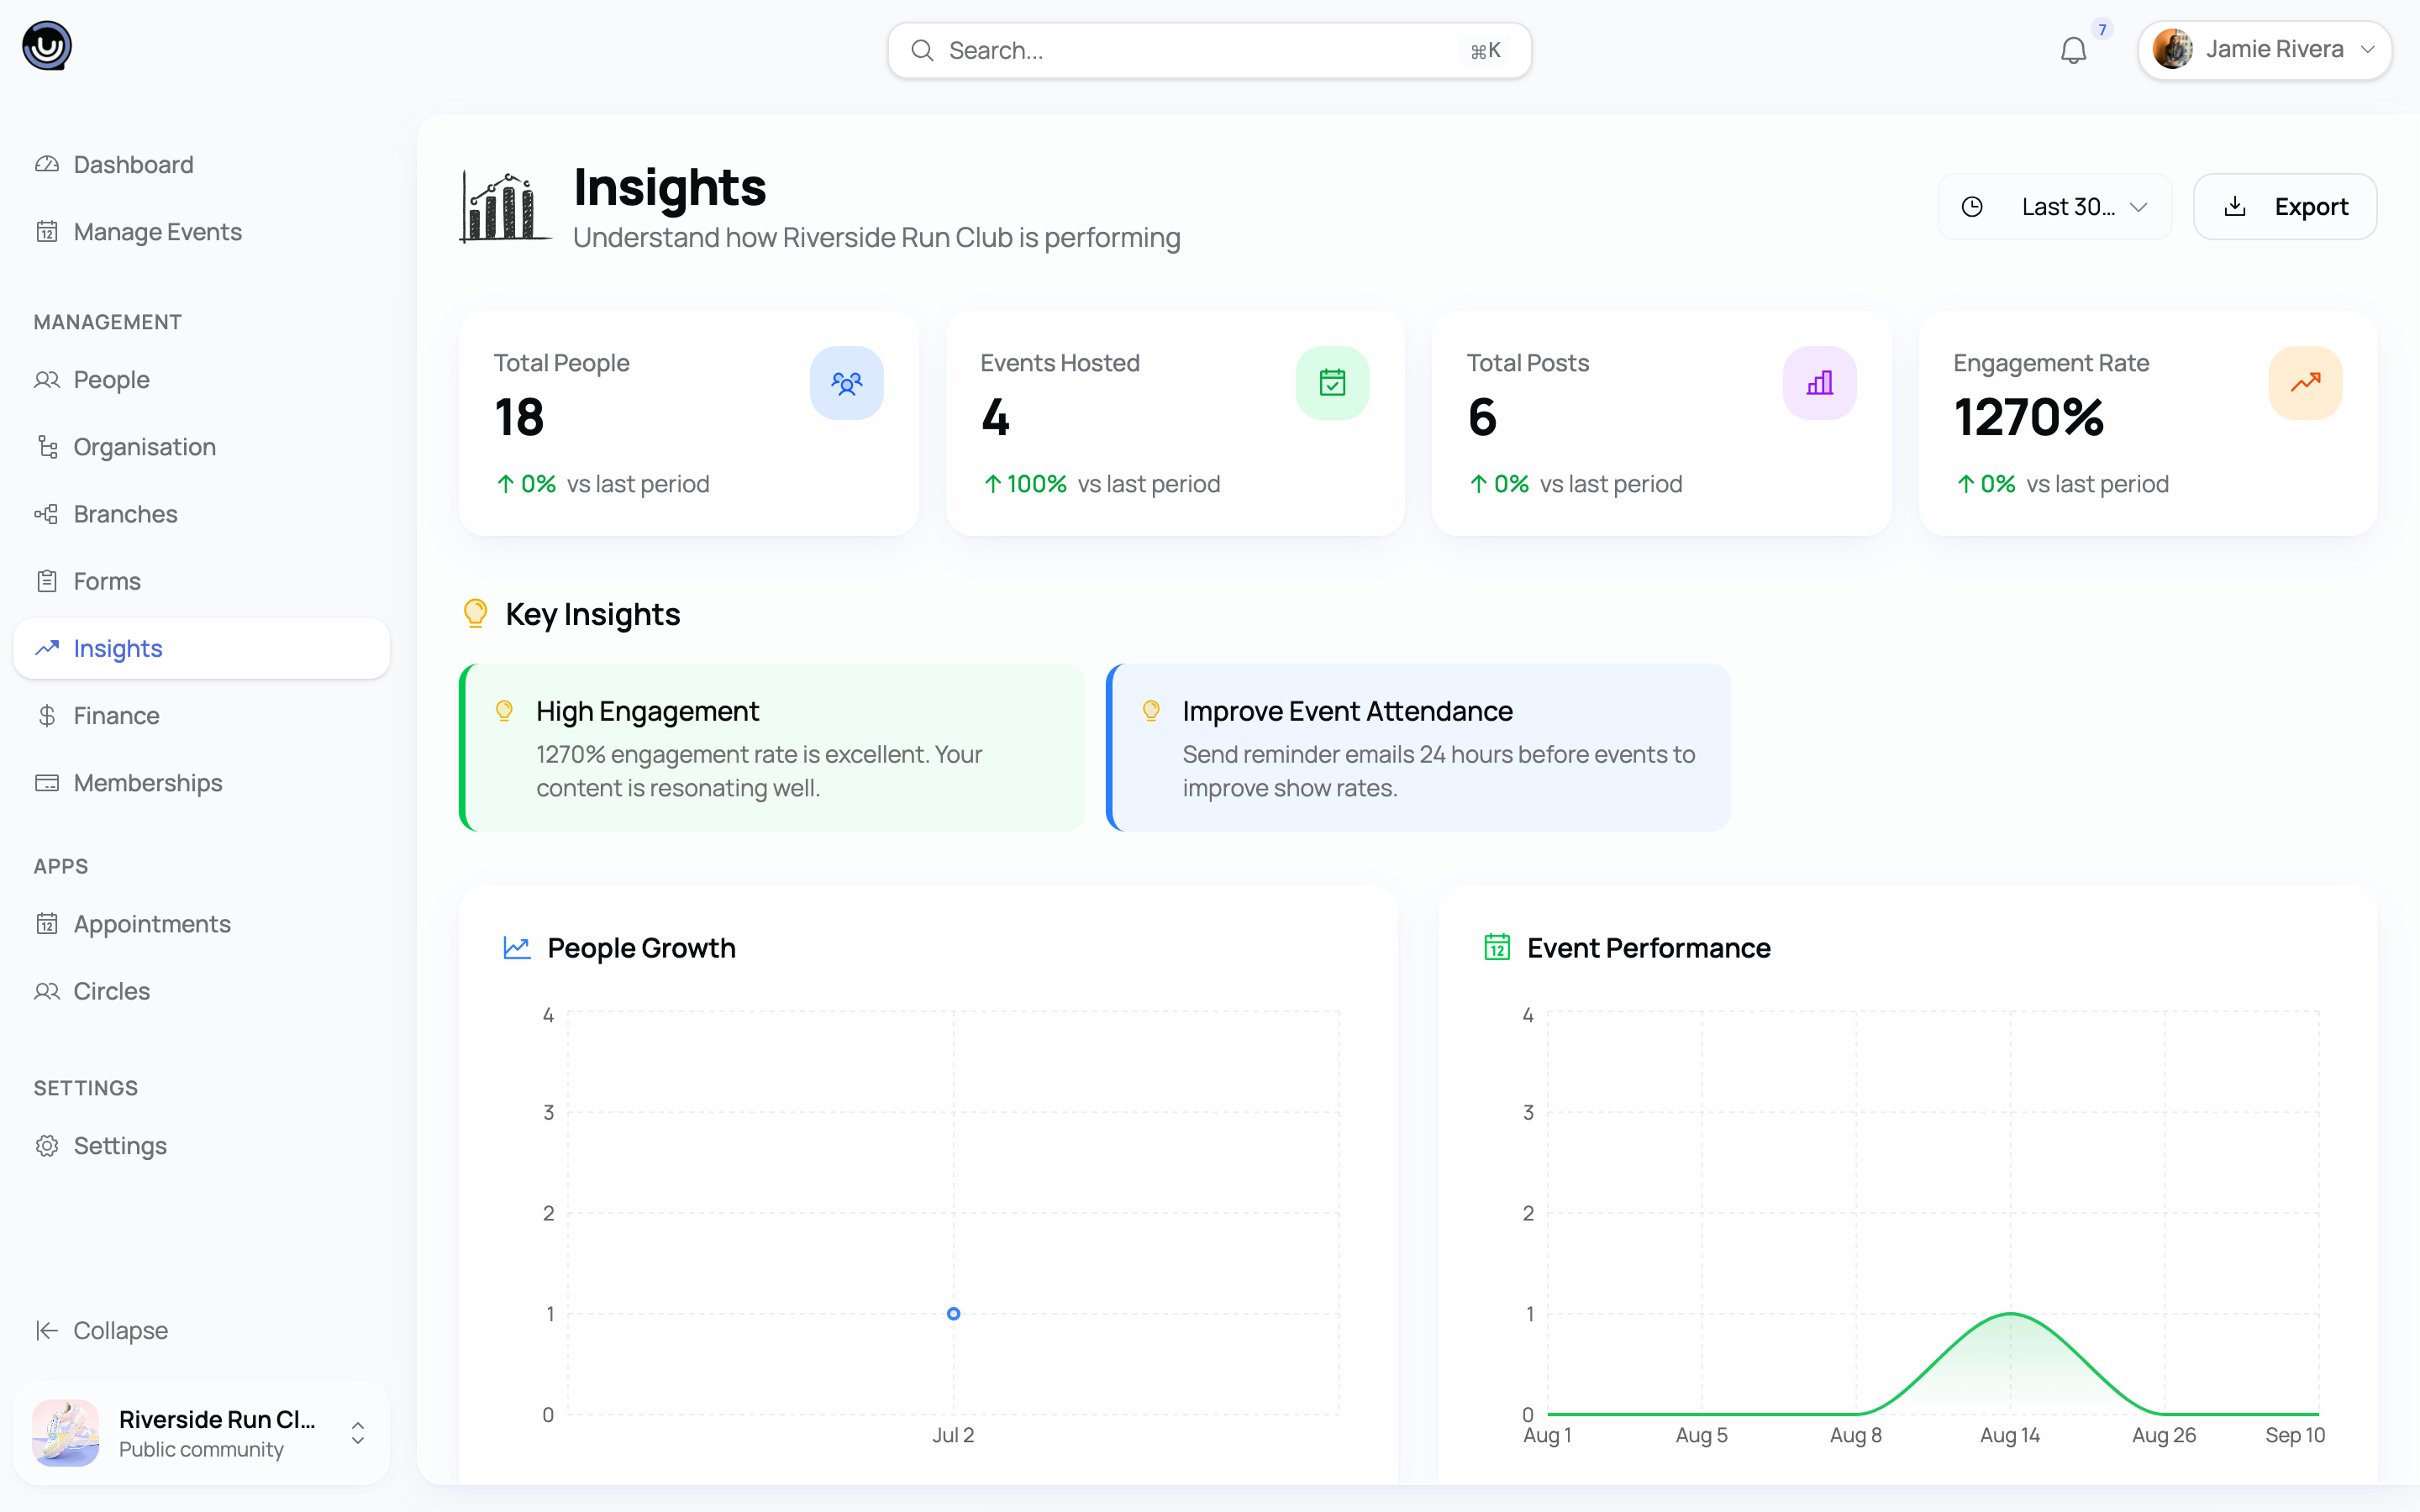
The Insights page is where you check the health of your community: how many people are joining, how your events are performing, and how engaged your members are. This guide walks through what's on the page and how to read it.
Where to find it
Open Insights from your community dashboard. If you manage more than one community, make sure the right one is selected first — Insights always shows data for a single community at a time, not a combined view across all the communities you run.
Insights and analytics are available from the Starter plan and up. If your community doesn't have an active subscription, you won't see meaningful data on this page.
Heads up. Only Owners and Admins can see the Insights page. Moderators and Members don't have access to community-level analytics.
Choosing a time range
At the top of the page, pick the period you want to look at:
- Last 7 days
- Last 30 days (default)
- Last 90 days
- Last year
Changing the time range refreshes every stat card, chart, and the Key Insights section at once.
The stat cards
Four cards summarise your community at a glance:
| Card | What it shows |
|---|---|
| Total People | Members who joined during the selected period, compared to the previous period of the same length |
| Events Hosted | Events created during the selected period |
| Total Posts | Posts published during the selected period |
| Engagement Rate | Comments, likes, and RSVPs relative to your posts and events, shown as a percentage |
Each card shows a percentage change against the period before it, with an up or down arrow.
Heads up. "Total People" on this page counts members who joined within the selected time range — it isn't your all-time member count. If you want your full roster size, check your member directory instead.
People Growth and Event Performance charts
Two charts sit below the stat cards:
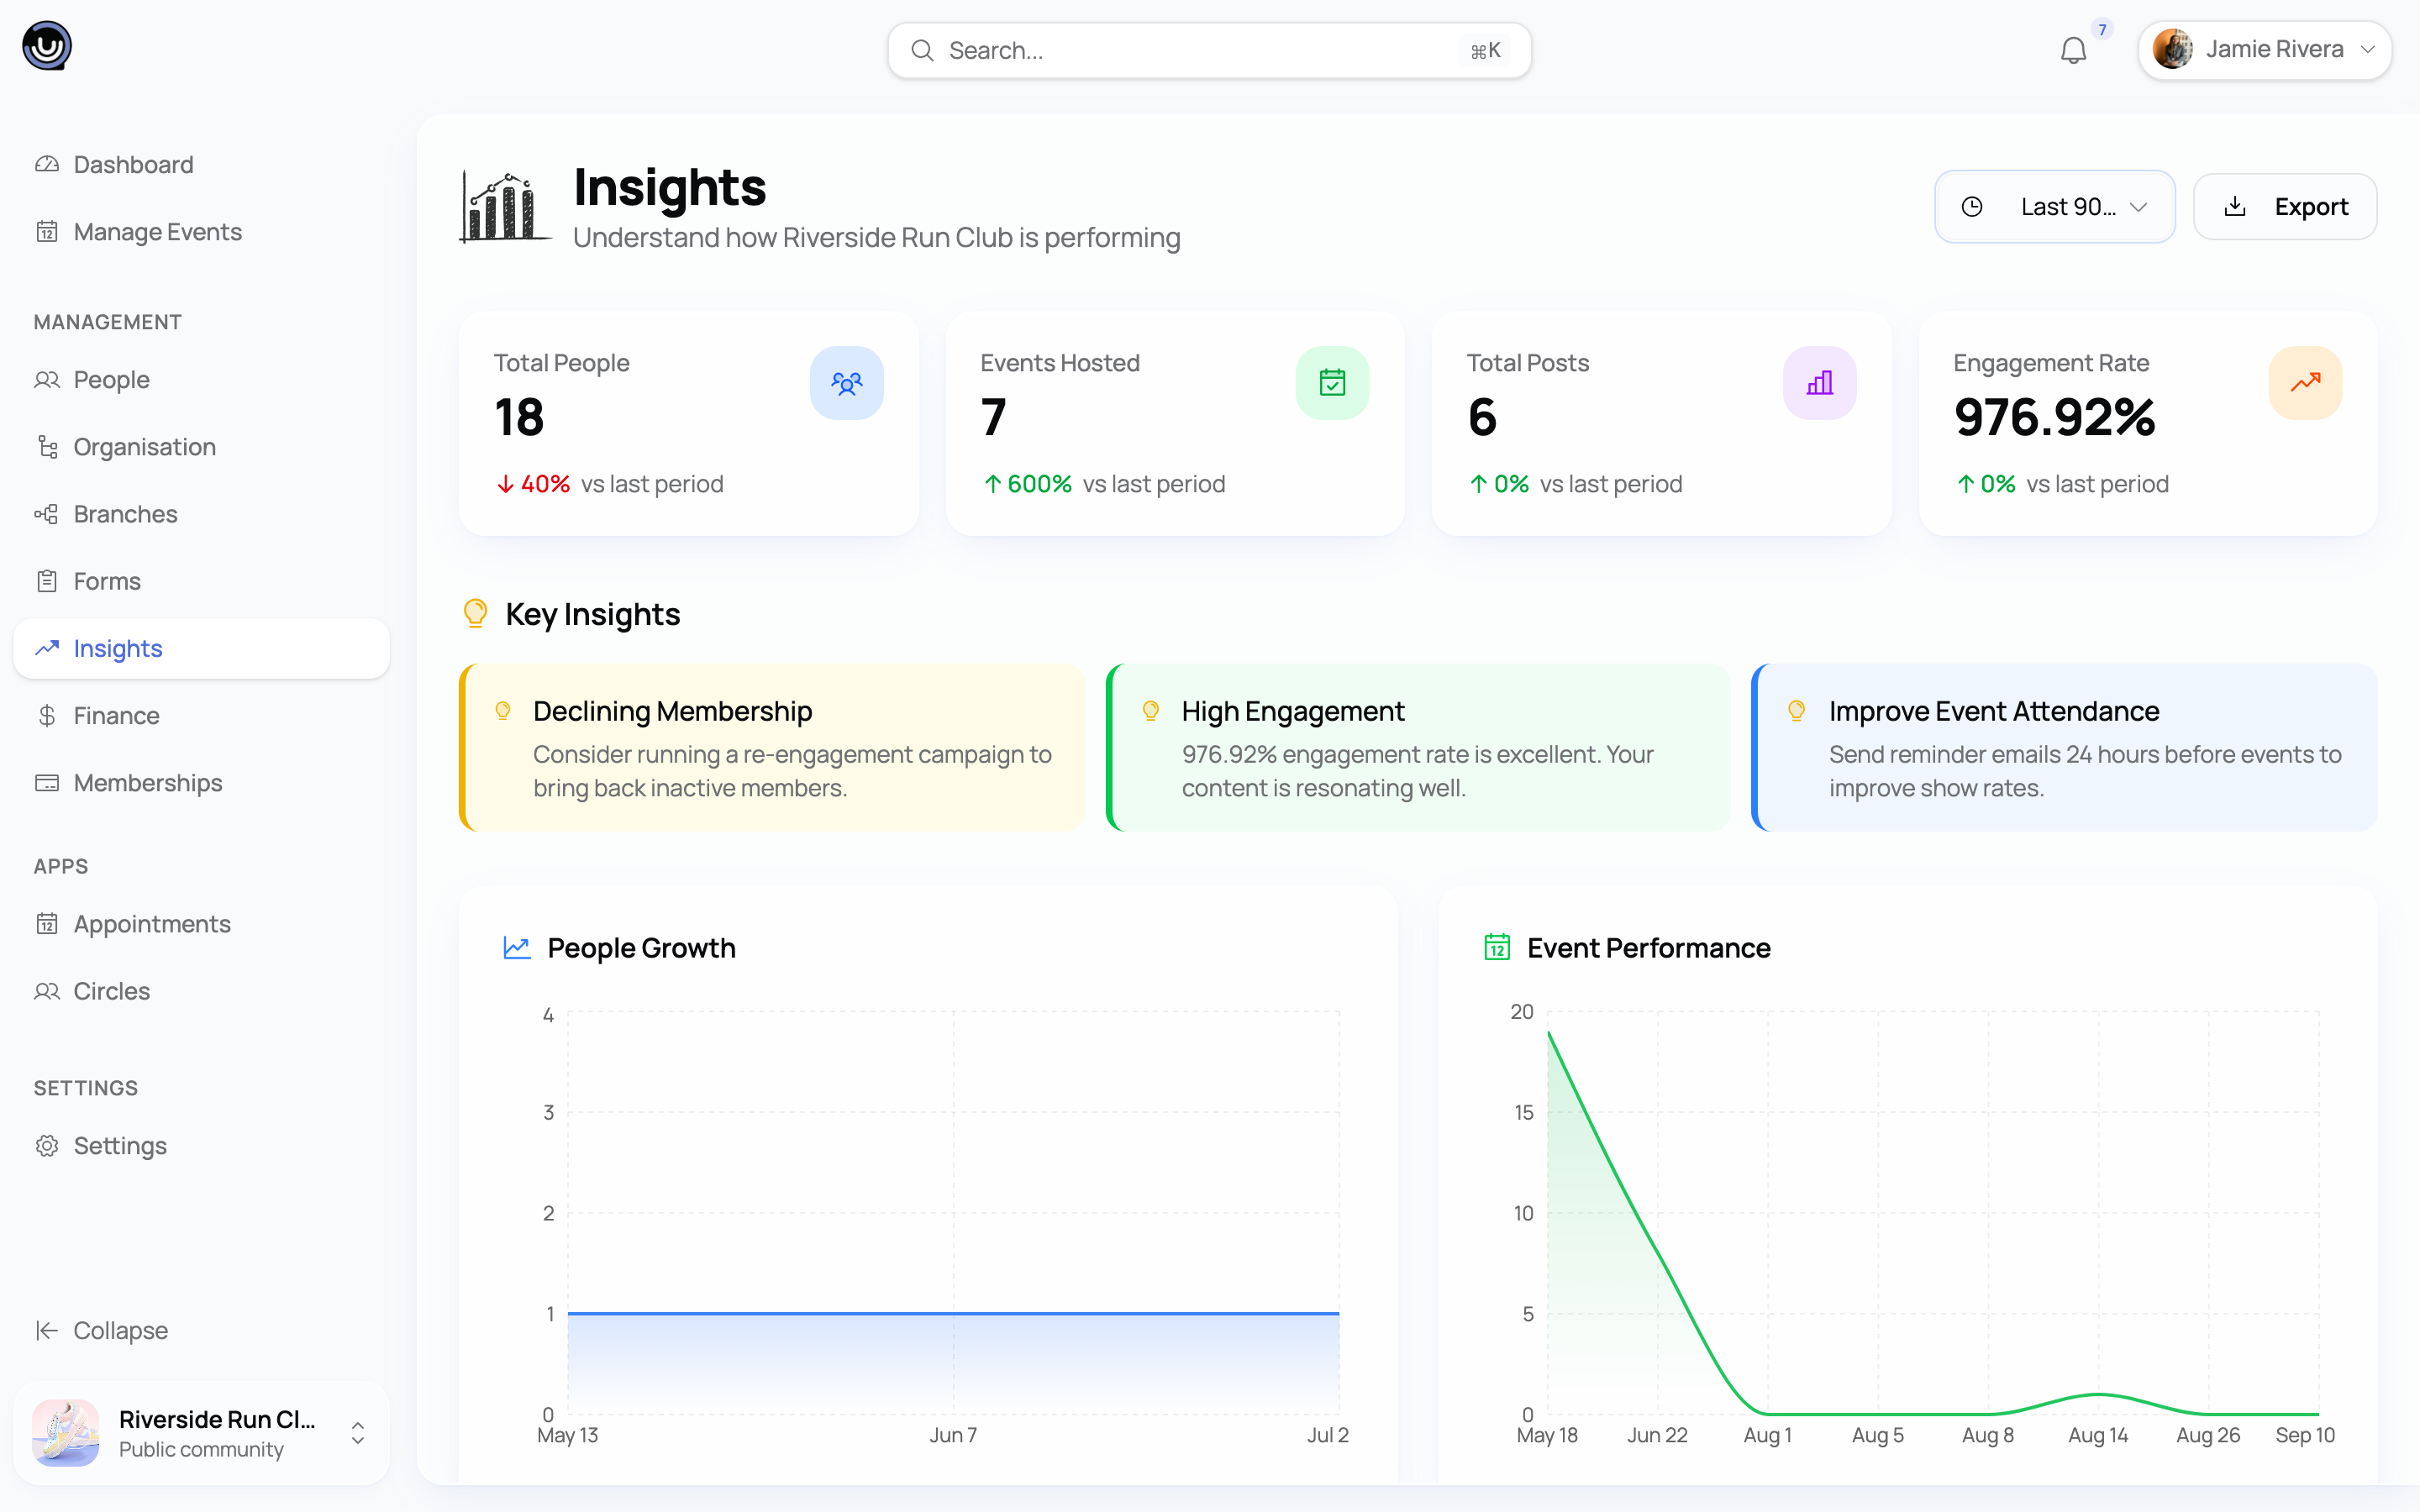
- People Growth — new members joining, plotted day by day across the selected period.
- Event Performance — checked-in attendees across your events, plotted by event date.
Both charts show an empty state if there's no activity to plot for the period you've selected.
Key Insights
Below the charts, the Key Insights section calls out a few observations about your community — things like strong growth, declining membership, or low engagement, based on the numbers in the period you've selected. These are automatic, rule-based observations rather than a personalised report, so use them as a starting point rather than the full picture.
Exporting your data
Click Export Data to download a CSV of everything on the page: your overview metrics, event performance by day, member growth by day, and a breakdown of your top events by attendance and check-in rate. The file is named after your community and the date it was generated, so it's easy to keep track of exports over time.
CSV export is part of the Business plan. If nothing has loaded on the page yet, you'll see a message telling you there's no data available to export — give the page a moment to load and try again.
Quick tips
The Insights page also includes a Quick Tips card with general suggestions for growing engagement — hosting more events, sending reminders, and sharing your community link. It's general guidance, not calculated from your data.